

Kubernetes Traefik Ingress: 10 Useful Configuration Options
This article takes a comprehensive look at Traefik's inner workings, guiding you through ten vital configuration options.
Ingress is a crucial Kubernetes API object responsible for overseeing external access to services within a cluster, commonly via HTTP, with the goal of providing routing configurations. Traefik steps into the picture as a dynamic, reliable Kubernetes ingress controller, streamlining cluster access management.
Distinguishing itself from conventional controllers, Traefik exclusively generates dynamic configurations driven by incoming ingress events, ensuring smooth integration and flexibility for modern applications and services. This keen ability to adapt to real-time changes positions Traefik as a standout choice in highly dynamic environments.
Evaluating Traefik Configuration Types
Traefik operates on two kinds of configurations - static and dynamic, each addressing a separate function:
- The static configuration establishes Traefik's core behavior and is initiated at startup. This configuration covers settings such as entry points, providers, API options, and logging. It is crucial to recognize that once Traefik is up and running, any changes to static configurations require a service restart.
- The dynamic configuration outlines Traefik's interactions with various services, like routers and middleware. Interestingly, the dynamic configuration offers flexibility- it can be modified and reloaded instantaneously without needing to restart Traefik.
It is essential to understand the interrelated nature of these settings. For example, dynamic configurations are derived from providers configured in the static configuration, including a Kubernetes ingress controller, Amazon ECS, and more.
In essence, static configurations provide the framework for Traefik's operation, while dynamic configurations guide Traefik's interaction with applications.
1. Enabling the Traefik Dashboard
The Traefik dashboard provides an easy-to-use interface for displaying active services, routes, connections, and comprehensive network traffic data within a Kubernetes cluster. Imagine a user deploys an application, such as a homepage, in their Kubernetes environment:
They have the option to execute the kubectl get svc command, resulting in output similar to this:
<pre class="codeWrap"><code>NAME TYPE CLUSTER-IP EXTERNAL-IP PORT(S) AGE
service/kubernetes ClusterIP 10.43.0.1 <none> 443/TCP 3h11m
service/homepage ClusterIP 10.43.143.214 <none> 3000/TCP 45m
</code></pre>
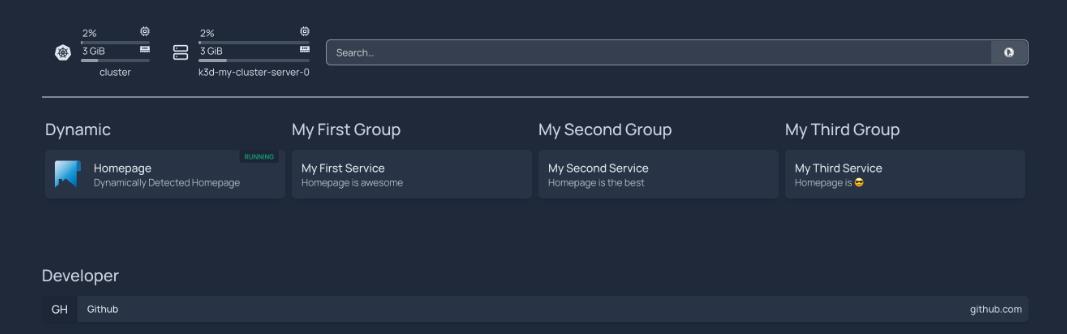
Alternatively, they can activate the Traefik dashboard, which lets them visualize their application's information through an intuitive graphical interface. Here's a sample of what the homepage service might look like on the dashboard:

Additionally, if required, users have the option to increase the capabilities of the Traefik dashboard using plugins, thereby managing TLS Authentication, GeoBlock services, among others.
Let's learn how to enable the Traefik dashboard.
When Traefik is installed via Helm, the dashboard is activated by default. The next step would be to port forward the service to the local machine:
<pre class="codeWrap"><code>kubectl -n traefik port-forward deployments/traefik 9000:9000</code></pre>
Here, traefik is the namespace utilized for deploying Traefik, and 9000 serves as the default service port.
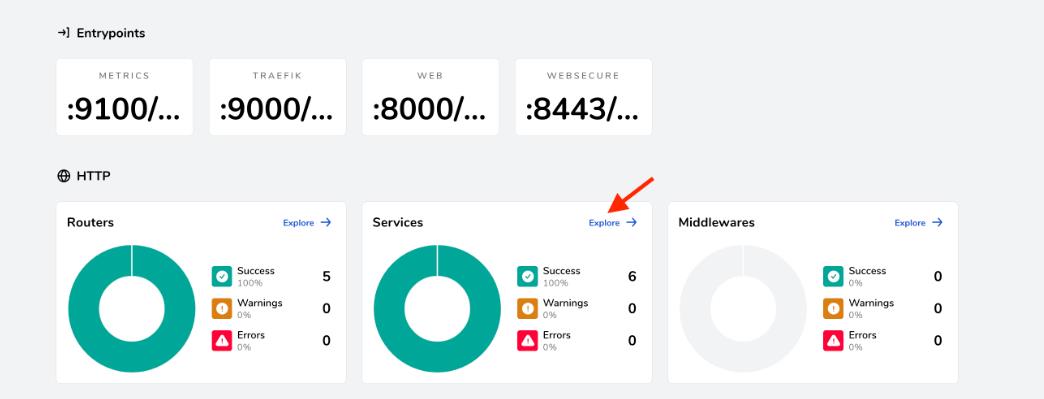
To view the dashboard, users have to navigate to http://localhost:9000/dashboard/. The screen they observe should look similar to the one below:
One benefit of installing Traefik via Helm is the flexibility to modify its configuration utilizing the values.yaml file integrated into the chart.
Hence, if there's a need to adjust the dashboard configuration (for instance, the access port), a simple edit to the values.yaml file followed by an update of the cluster using the following command is all that's required:
<pre class="codeWrap"><code>helm upgrade --install --namespace=traefik traefik traefik/traefik -f values.yaml</code></pre>
Editing the values.yaml file can also be particularly helpful for tasks such as setting up HTTPS, which ensures a secure connection to a website or application.
2. Setting Up HTTPS
In the current digital age, securing the transmission of data between users and services has become vital. But why is that? Encrypted communications prevent unauthorized access to sensitive information, mitigating the risks of attacks such as man-in-the-middle. It's here that Traefik steps in, capitalizing on HTTPS and TLS protocols to provide an additional layer of security that builds user confidence in your applications.
Additionally, search engines like Google place HTTPS-enabled websites higher in their ranking, increasing your site's visibility. Thus, integrating HTTPS into Traefik not only strengthens your website's security but also enhances its SEO standing.
The procedure to implement HTTPS in Traefik requires an understanding of both static and dynamic configurations.
For HTTPS implementation, it's necessary to have a valid certificate issued by a Certificate Authority (CA). Setting up the configuration for the particular CA provider can be achieved by including arguments in the values.yaml file, which then gets passed to Helm during the first configuration stage of Traefik:
<pre class="codeWrap"><code>...
additionalArguments:
...
- --certificatesresolvers.cloudflare.acme.dnschallenge.provider=cloudflare
- --certificatesresolvers.cloudflare.acme.email=mail@example.com
- --certificatesresolvers.cloudflare.acme.dnschallenge.resolvers=1.1.1.1
- --certificatesresolvers.cloudflare.acme.storage=/certs/acme.json
...
</code></pre>
In the example above, Cloudflare is designated as the certificate resolver. Simultaneously, within the same file, you can define the secrets that will be employed in the dynamic configuration for accessing the Cloudflare API:
<pre class="codeWrap"><code>...
env:
- name: CF_API_EMAIL
valueFrom:
secretKeyRef:
key: email
name: cloudflare-api-credentials
- name: CF_API_KEY
valueFrom:
secretKeyRef:
key: apiKey
name: cloudflare-api-credentials
...
</code></pre>
To execute this configuration, you must create the corresponding secrets as well as the IngressRoute configuration, which is then applied within your Kubernetes cluster. This IngressRoute configuration should utilize the created secrets and declare the domains to which it applies. An example structure is illustrated below:
<pre class="codeWrap"><code>apiVersion: traefik.containo.us/v1alpha1
kind: IngressRoute
metadata:
name: your-ingressroute-name
namespace: traefik
spec:
entryPoints:
- websecure
routes:
- match: Host(`example.com`)
kind: Rule
services:
- name: your-service-name
port: your-service-port
tls:
secretName: your-secret-name
...
</code></pre>
Once HTTPS has been set up, the next logical step entails configuring the Traefik entry points that benefit from this secure connection.
3. Configuring Entry Points
Configuring Traefik entry points is vital, as they delineate the network ports where Traefik listens for incoming requests. These entry points act as a conduit that guides traffic toward the relevant services.
By indicating protocols (HTTP or HTTPS), addresses, and other characteristics, entry points effectively manage network communication. They also play a pivotal role in load balancing, allowing Traefik to evenly allocate network connections across multiple servers, thus enhancing system performance and reliability on the whole.
During Traefik's installation via Helm, the entry points web (listening on port 8000 and exposed to port 80) and websecure (listening on port 8443 and exposed to port 443) are established. It is possible to modify these settings by editing the values.yaml file or integrating more entry points:
<pre class="codeWrap"><code>...
additionalArguments:
- --entrypoints.websecure.http.tls.certresolver=cloudflare
- --entrypoints.websecure.http.tls.domains[0].main=example.com
...
</code></pre>
As exhibited, websecure entry points have been configured in liaison with Cloudflare's resolver for the example.com domain.
Even though the values.yaml file can be conveniently modified, the static configuration it provides lacks flexibility. That's where the role of middleware becomes significant.
4. Setting Up Middleware
Middleware in Traefik is pivotal to handling requests as it grants users the flexibility to customize the server's operations. Its capabilities range from adding, deleting, or modifying request and response headers, rerouting requests, to even enforcing access control. It can additionally maintain a sequence of diverse middleware that can be sequentially applied to inbound requests.
The adaptability offered by middleware increases Traefik's functionality, making it a highly flexible choice for administering network communications. It fundamentally operates as a conduit between the network and the application. This ensures that communication is modified to cater for particular needs and requirements.
Assuming the goal is to reveal the Traefik dashboard. Along with the HTTPS setup examined above, it is recommended to include additional protection. In this regard, the BasicAuth middleware can be instrumental. To put it into effect, you can either modify the values.yaml file or generate a custom traefik-values.yaml file similar to the following:
<pre class="codeWrap"><code># Create an IngressRoute for the dashboard
ingressRoute:
dashboard:
enabled: true
# Additional ingressRoute annotations (eg for kubernetes.io/ingress.class)
annotations: {}
# Additional ingressRoute labels (eg for filtering IngressRoute by custom labels)
labels: {}
# The router match rule used for the dashboard ingressRoute
matchRule: PathPrefix(`/dashboard`) || PathPrefix(`/api`)
# Specify the allowed entry points to use for the dashboard ingress route: traefik, web, websecure.
# By default, it's using the traefik entry point, which is not exposed.
# /!\ Do not expose your dashboard without any protection over the internet /!\
entryPoints: ["traefik"]
# Additional ingressRoute middleware (eg for authentication)
middlewares:
- name: dashboard-auth
# Secret with admin user credentials
extraObjects:
- apiVersion: v1
kind: Secret
metadata:
name: dashboard-auth-secret
type: kubernetes.io/basic-auth
stringData:
username: admin
password: YourPassword
# BasicAuth middleware definition
- apiVersion: traefik.containo.us/v1alpha1
kind: Middleware
metadata:
name: dashboard-auth
spec:
basicAuth:
secret: dashboard-auth-secret
</code></pre>
The above is a simple example. Traefik provides a myriad of HTTP middleware and TCP middleware options that an organization can tailor according to its requirements.
5. Configuring Traefik Load Balancing
In Traefik, the role of load balancing is to allocate incoming requests across a multitude of servers and services, thereby averting system overloads. This leads to optimized resource use, increased responsiveness, and high system availability. Moreover, load balancing assists in minimizing downtime by rerouting traffic during instances of server breakdowns.
To facilitate this, Traefik is compatible with multiple load balancing algorithms (such as round robin and least connections) and delivers real-time metrics, allowing for dynamic and smart traffic management. On the whole, it upgrades application performance and offers a sturdy, scalable solution for handling traffic surges.
The documentation offers numerous instances of implementing load balancing in Traefik. For example, you could use the ensuing code to equitably distribute multiple user requests among two services based on their weights:
<pre class="codeWrap"><code># Dynamic configuration
http:
services:
app:
weighted:
services:
- name: appv1
weight: 3
- name: appv2
weight: 1
appv1:
loadBalancer:
servers:
- url: "http://private-ip-server-1/"
appv2:
loadBalancer:
servers:
- url: "http://private-ip-server-2/"
</code></pre>
This dynamic configuration for Traefik outlines two services, namely appv1 and appv2. The weighted service combines both appv1 and appv2, with appv1 holding a higher weight rating (3) as compared to appv2 (1). This implies that out of every set of four requests, appv1 will handle three, and the remaining one goes to appv2, thereby effectively balancing the load.
Furthermore, each service possesses its load balancer, responsible for rerouting traffic to varying servers. These servers are identified by their distinct URLs: http://private-ip-server-1/ for appv1 and http://private-ip-server-2/ for appv2.
This dynamic setup can be defined within the values.yaml file by leveraging the Traefik file provider:
<pre class="codeWrap"><code>providers:
file:
directory: "/path/to/dynamic/conf"
</code></pre>
This way, you're able to edit the dynamic configuration as needed. Please note that load balancing should not be confused with automatic redirects.
6. Configuring Automatic Redirects
It's crucial for Traefik to establish automatic redirects to enhance the user experience and ensure secure network connections. The RedirectScheme middleware is capable of rerouting requests to various schemes or ports, a feature that is particularly useful when operating behind a reverse proxy. Here's a sample code snippet from the documentation that enforces the use of HTTPS:
<pre class="codeWrap"><code># Redirect to https
apiVersion: traefik.io/v1alpha1
kind: Middleware
metadata:
name: https-redirect
spec:
redirectScheme:
scheme: https
permanent: true
</code></pre>
To integrate this middleware, you simply need to create a configuration file, such as https-redirect.yaml, and deploy it to the Kubernetes cluster:
<pre class="codeWrap"><code>kubectl apply -f https-redirect.yaml</code></pre>
Following that, generate an IngressRoute that utilizes the https-redirect middleware. The configuration might look like this:
<pre class="codeWrap"><code>apiVersion: traefik.containo.us/v1alpha1
kind: IngressRoute
metadata:
name: myingressroute
spec:
entrypoints:
- web
routes:
- match: Host(`example.com`) && PathPrefix(`/`)
kind: Rule
services:
- name: myapp
port: 80
middlewares:
- name: https-redirect
tls:
certResolver: myresolver
</code></pre>
Then, apply it:
<pre class="codeWrap"><code>kubectl apply -f myingressroute.yaml</code></pre>
Through this setup, any traffic requests to example.com on port 80 will automatically be rerouted to HTTPS. This method can be applied to redirect traffic across any combination of ports.
Another beneficial middleware is RedirectRegex, which can guide users to varying locations contingent on regex matching and replacement, resulting in better traffic management and improved user navigation. Here's an illustrative piece of code directing any request from localhost to http://mydomain/:
<pre class="codeWrap"><code># Redirect with domain replacement
apiVersion: traefik.io/v1alpha1
kind: Middleware
metadata:
name: test-redirectregex
spec:
redirectRegex:
regex: ^http://localhost/(.*)
replacement: http://mydomain/${1}
</code></pre>
Implementing permanent redirections enhances security by guaranteeing that users are constantly directed to the appropriate and secure destinations. Overall, these automated redirection capabilities in Traefik lead to a more fluid and safe browsing experience.
To ensure the availability of services, you may consider supplementing load balancing and automatic redirects with rate limiting.
7. Enabling Rate Limiting
Implementing rate limiting within Traefik is an essential measure to safeguard against potential abuse of services. It achieves this by regulating the quantity of requests a client can issue within a designated time frame, which in turn prevents the system from collapsing under too many requests – a common characteristic of DDoS attacks or bot-generated traffic.
By capping the number of requests, rate limiting allows an equitable distribution of resources. This ensures the preservation of system functionality, and secures the availability of the service for every user.
The use of Traefik's middleware is particularly helpful in enforcing rate limiting. Below is a sample code that defines the ratelimit middleware:
<pre class="codeWrap"><code>apiVersion: traefik.containo.us/v1alpha1
kind: Middleware
metadata:
name: ratelimit
spec:
rateLimit:
average: 100
burst: 50
</code></pre>
In the above example, the rate limit is configured to permit an average of 100 requests every second, with the capacity to handle surges of up to 50 additional requests.
You can deploy the middleware to your Kubernetes cluster using kubectl:
<pre class="codeWrap"><code>kubectl apply -f ratelimit-middleware.yaml</code></pre>
Similar to prior examples, you must generate an IngressRoute that utilizes the ratelimit-middleware.yaml middleware. Here is a sample:
<pre class="codeWrap"><code>apiVersion: traefik.containo.us/v1alpha1
kind: IngressRoute
metadata:
name: myingressroute
spec:
entryPoints:
- web
routes:
- match: Host(`example.com`)
kind: Rule
services:
- name: myapp
port: 80
middlewares:
- name: ratelimit
</code></pre>
This IngressRoute configuration employs the web entry point for example.com and enforces a ratelimit middleware on its traffic, which acts as a safeguard to prevent any potential misuse of your service. For more available options, delve into the RateLimit middleware documentation.
While rate limiting stands as a valuable tool, one might consider what alternative steps could be taken were the service to go down for reasons unrelated to misuse. In such scenarios, the configuration of health checks might be the appropriate course of action.
8. Configuring Health Checks
Traefik's health checks actively contribute to maintaining the uptime of applications by regularly evaluating the status of services. This automated supervision ensures optimal service performance and, in the event of failure, the system seamlessly reassigns traffic to properly functioning instances, minimizing downtime.
Consequently, this enhances reliability, accessibility, and the overall user experience, as it mitigates the occurrence of errors and service disruptions.
It is crucial to recognize that Traefik's health checks are not available for KubernetesCRD and KubernetesIngress providers. This is because Kubernetes itself employs a comprehensive health check system, effectively removing any unhealthy pods. In turn, these unwell pods lack Kubernetes endpoints, preventing Traefik from forwarding traffic to them.
Thus, Kubernetes' inherent health check mechanism works in tandem with Traefik’s capabilities to ensure the optimal efficiency and uptime of applications.
Despite this, users have the option to generate a dynamic configuration and apply it utilizing the file provider:
<pre class="codeWrap"><code># Dynamic configuration
http:
services:
Service-1:
loadBalancer:
healthCheck:
path: /health
interval: "10s"
timeout: "3s"
</code></pre>
The provided code configures a health check for Service-1, which it carries out by reaching the /health path of the service. It conducts these checks at ten-second intervals, and if the service doesn't respond within three seconds (the defined timeout period), it deems the service unhealthy.
Accordingly, this test rapidly identifies any problems with Service-1, enabling quick remediation. This rapid detection-and-response approach helps to minimize service downtime and bolsters overall service availability.
Despite best efforts, it's inevitable that error codes and downtime will occur. As such, it's beneficial to be a step ahead and configure custom error pages.
9. Setting Up Custom Error Pages
Configuring custom error pages via the Errors middleware in Traefik can significantly enhance the user experience. This setup allows for specialized responses to various HTTP status codes, which can provide more detailed and informative communication than standard error messages seen in browsers.
Consider the following code snippet from the documentation:
<pre class="codeWrap"><code>apiVersion: traefik.io/v1alpha1
kind: Middleware
metadata:
name: test-errors
spec:
errors:
status:
- "500-599"
query: /{status}.html
service:
name: whoami
port: 80
</code></pre>
In this example, the status parameter is set to activate a custom error page in response to error codes ranging from 500 to 599. Additionally, the service and query parameters dictate the specific content and URL for this page, further personalizing the response for a better user experience.
Dealing with errors requires effective troubleshooting capabilities, and this is addressed by the critical step of enabling access logs within the configuration.
10. Enabling Access Logs
Setting up access logs in Traefik is crucial for efficient monitoring, effective troubleshooting, as well as improving overall security. These logs offer comprehensive records of all inbound requests, providing real-time monitoring of the system's health.
They assist in identifying trends, pinpointing issues, and tracing anomalies, thus expediting problem-solving. From a security standpoint, access logs act as a preventive barrier, aiding in spotting suspicious activities and potential security breaches, hence countering cyber threats.
The official documentation elaborates on the various options available for configuring access logs in Traefik. Here is an example of how to structure filters for capturing logs pertaining to specific status codes:
<pre class="codeWrap"><code># Configuring multiple filters
accessLog:
filePath: "/path/to/access.log"
format: json
filters:
statusCodes:
- "200"
- "300-302"
retryAttempts: true
minDuration: "10ms"
</code></pre>
In the provided code:
- filePath: "/path/to/access.log" indicates the designated location for storing the access log.
- format: json defines the log's structure as JSON.
- Within filters, statusCodes are defined to record only those requests that yield HTTP status code 200 or codes ranging between 300 and 302, inclusive.
- retryAttempts: true means that any attempts to retry will be captured in the log as well.
- minDuration: "10ms" restricts logging to only those requests that take a minimum of 10 milliseconds to process. The ones with faster processing times will not be recorded in the log.
Conclusion
This article has delved into several configuration alternatives for Traefik ingress within a Kubernetes environment. The salient points drawn can be encapsulated around the significance of configuring access logs, automating redirects, designing custom error pages, defining entry points, conducting health checks, enforcing rate limiting, deploying HTTPS, and turning on the Traefik dashboard. The article also underscored the critical role that middleware plays in implementing many of these functionalities in Traefik.


Facing Challenges in Cloud, DevOps, or Security?
Let’s tackle them together!
get free consultation sessions
We will contact you shortly.
