

Shared GPU Resources: Efficient Access Part 3
Today we continue our series on efficient access to shared resources and GPUs within Kubernetes. Make sure you’re up to date before reading part 3.
The specifications of GPU hardware are incredibly useful for forecasting a program's execution speed, its power consumption, or determining the most appropriate device for varying workloads. However, conducting GPU benchmarks is equally critical to verify if theoretical assumptions are upheld by real-world tests. This testing method can assist in identifying challenges that are best tackled in the early stages.
Keeping this in mind, we have chosen to benchmark the GPUs with a range of loads, drawing motivation from some of our primary use cases:
- FLOPS Count
- Compute-Intense Particle Simulations
- Machine Learning Training
FLOPS Counting
The principal metric used to demonstrate a GPU's prowess when handling diverse data formats is Floating Point Operations Per Second (FLOPS). However, FLOPS counting can be a challenging task! To avoid the complexity of crafting our own matrix multiplication code, we will use dcgmproftester, a CUDA-based test load generator from NVIDIA that efficiently manages the intricacies on our behalf.
The dcgmproftester script, which is straightforward to utilize, generates loads that result in GPU usage of over 90%, making it an ideal benchmarking tool. It is delivered along with the CUDA kernel as a binary.
The dcgmproftester comes with several usage options:
- In the case of Kubernetes, NVIDIA DCGM is included with the NVIDIA GPU Operator installation. This is the preferred option discussed in this series of blog posts.
- Alternatively, one can utilize dcgm images, check the available tags.
- It's essential to note that using the dcgmproftester images obtainable as part of Nvidia samples on Docker Hub is not recommended because of the lack of ongoing support.
The dcgmproftester command supports several arguments:
- The -t flag is used to specify the profiling fieldId. The full list of profiling identifiers can be found here. For benchmarking, we use the following IDs:
-ID 1008 for fp16 profiling
-ID 1007 for fp32 profiling
-ID 1006 for fp64 profiling
-ID 1004 for Tensor Cores profiling
- The -d flag can be used to specify how long (in seconds) to perform the test.
- The -i flag specifies the id of the GPU to execute.
- The --no-dcgm-validation flag allows dcgmproftester to solely generate test loads.
For instance, to benchmark the fp32 performance on the GPU with id 0 over a duration of 50 seconds, one would use this command:
<pre class="codeWrap"><code>/usr/bin/dcgmproftester11 --no-dcgm-validation -t 1007 -d 50 -i 0</code></pre>
Compute-Intensive Particle Simulations
At our organization, a large portion of the computational burden is dedicated to simulations. These simulations are compute-intensive operations that can gain significantly from the use of GPUs.
The following are steps to recreate the experiment:
- Utilize the image via gitlab-registry.cern.ch/hep-benchmarks/hep-workloads-gpu/simpletrack/nvidia:latest
- You will find the simulation script at the path simpletrack/examples/lhc/
- Run the simulation command to run using ./lhc-simpletrack.sh -p <number_of_particles>
- Utilize /usr/bin/time instead of just time, to measure the time taken for execution.
Machine Learning Training
The benchmarks are carried out based on a Transformers tutorial, utilizing a pre-trained model known as bert-base-cased and honing it through PyTorch. The script is evaluated using the nvcr.io/nvidia/pytorch:22.10-py3 image.
Key points to remember while benchmarking include:
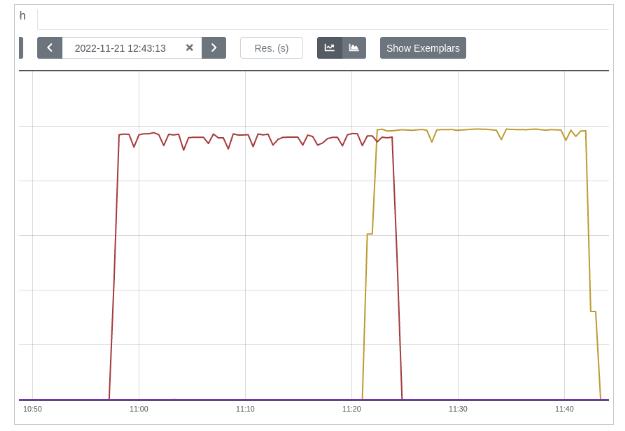
- Ensure that the benchmarking process is not CPU-bound. Originally, the model was trained with just one data loader worker, due to which GPU utilization ranged between 88% and 96%. With the presence of multiple worker processes, GPU utilization exhibited greater stability, hovering around 98%, with only occasional spikes up to 95%. These spikes are correlated with the number of epochs employed.
- Augment the batch size in alignment with the memory space available. Experiment with powers of 2 until an OOM error surfaces. Batch sizes of 24/48 can also prove effective.
The strategies mentioned above assisted in achieving a smoother GPU utilization, which is vital for benchmarking purposes. Notice the difference below (spikes are tied to the number of epochs used, which total to 3 in this case):
Additional suggestions to improve GPU utilization:
- Incorporate a smarter data loader. For example, the FFCV loader, but there are numerous other options.
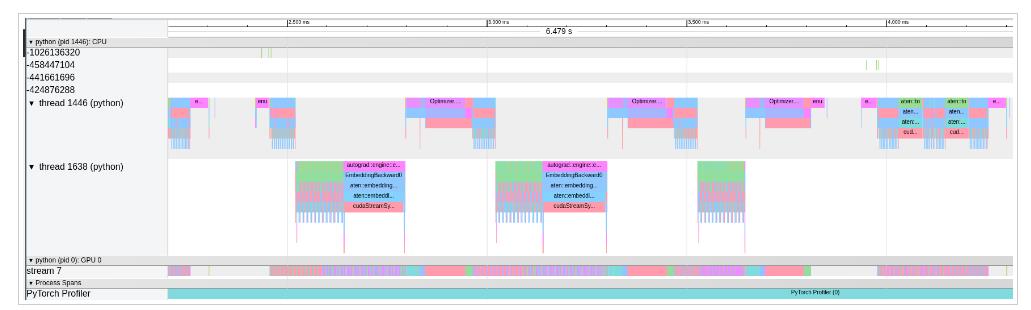
- Employ a high-quality profiler to understand which model operations are most expensive, the time of active CPU vs active GPU, and so forth. Torch.profiler is an excellent starting point. Also, one can opt to visualize the profiled operators and CUDA kernels in the Chrome trace viewer to spot model performance bottlenecks:
<pre class="codeWrap"><code>from torch.profiler import profile, ProfilerActivity
with profile(activities=[ProfilerActivity.CPU, ProfilerActivity.CUDA]) as prof:
trainer.train()
print(prof.key_averages().table(sort_by="cpu_time_total", row_limit=10))
prof.export_chrome_trace("trace.json")
</code></pre>
The code snippet will export the profiled data into a trace.json file. For a deeper understanding of the running processes, open the created file with chrome://tracing/.
Environment Setup
The benchmarking is exclusively performed on NVIDIA A100 40GB PCIe GPUs.
For maximum reproducibility, refer to the precise versions of the software employed in benchmarking:
- Kubernetes: 1.22
- Container runtime: containerd://1.4.13
- Kubectl: 1.25
- Cuda version utilized: 11.6
- Prometheus: prometheus:v2.28.1
- DCGM image tag: dcgm-exporter:2.4.5-2.6.7-ubuntu20.04
- Node OS image: Fedora CoreOS 35.20220227.2.1
- Node Kernel Version: 5.16.13-200.fc35.x86_64
- Driver Version: 470.129.06
Useful to Know
"NVIDIA System Management Interface (nvidia-smi) proves to be a useful command-line utility for checking GPU statistics. One notable feature is its ability to display processes utilizing the GPUs. However, this functionality is hindered by a containerized setup. nvidia-smi is not compatible with PID namespaces, rendering it unable to list running processes.
A comparison of outputs illustrates this:
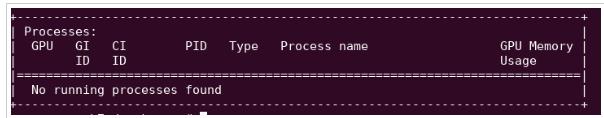
Output when the GPU is not in use explicitly indicating the absence of running processes.
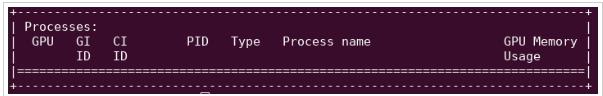
Output when there is at least one process within a container utilizing the GPU. In this case, the section remains empty.


Facing Challenges in Cloud, DevOps, or Security?
Let’s tackle them together!
get free consultation sessions
We will contact you shortly.
